
How tactical formations and team spacing relate to high-speed running in elite soccer.
When analysts discuss physical performance in soccer, they usually focus on total distance, sprints, and top speed. But those numbers don’t explain the tactical situations in which running occurs.
In our 2026 study of the 2022 FIFA World Cup, we explored whether team surface area (TSA)—the space a team occupies—was associated with running performance, and whether those relationships changed across formations and phases of play.
What is team surface area?
TSA is calculated as team width × team length. A team 40 meters wide and 30 meters long occupies a rectangular area of 1,200 m². Teams expand and contract as the ball moves and their tactical priorities change.
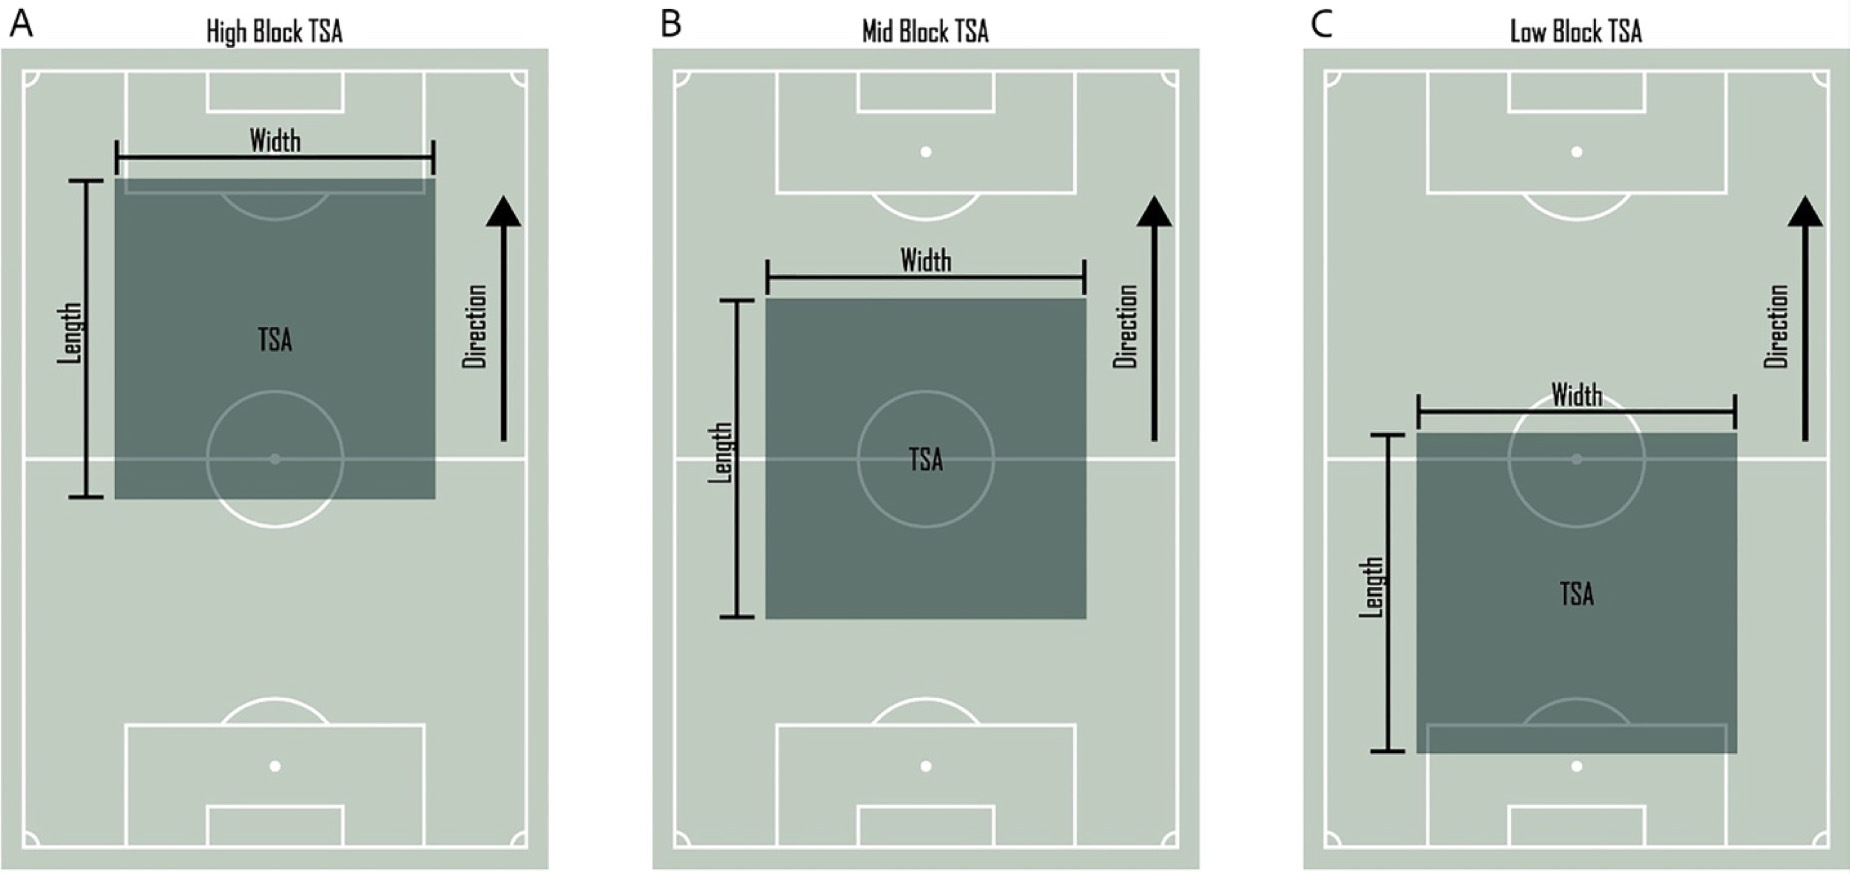
Figure 1. How TSA was defined across defensive phases. Reproduced from Böge et al. (2026).
What did we analyze?
We analyzed 31 national teams, 47 matches, and 68 team-match observations, drawing on 390 full-match outfield player observations. We compared the 3-4-3, 4-3-3, 4-4-2, and 4-2-3-1 formations using FIFA tracking reports. Running metrics included total distance, running at 20–25 km/h (Zone 4), running above 25 km/h (Zone 5), high-speed running actions, sprint actions, and maximum speed.
Finding 1: Space alone doesn’t tell the whole story
TSA by itself was not significantly associated with running outcomes after correction for multiple comparisons. The formation and phase of play mattered for how spacing related to high-speed running.
Finding 2: Low-block spacing had different relationships across formations
In a low defensive block, the relationship between TSA and high-speed running actions differed significantly across formations (adjusted p = 0.002). For each one-standard-deviation increase in low-block TSA, the estimated association was +7.67 HSR actions for 3-4-3, compared with −9.76 for 4-3-3 and −4.38 for 4-2-3-1. These are model-estimated slopes, not changes caused by switching formations.
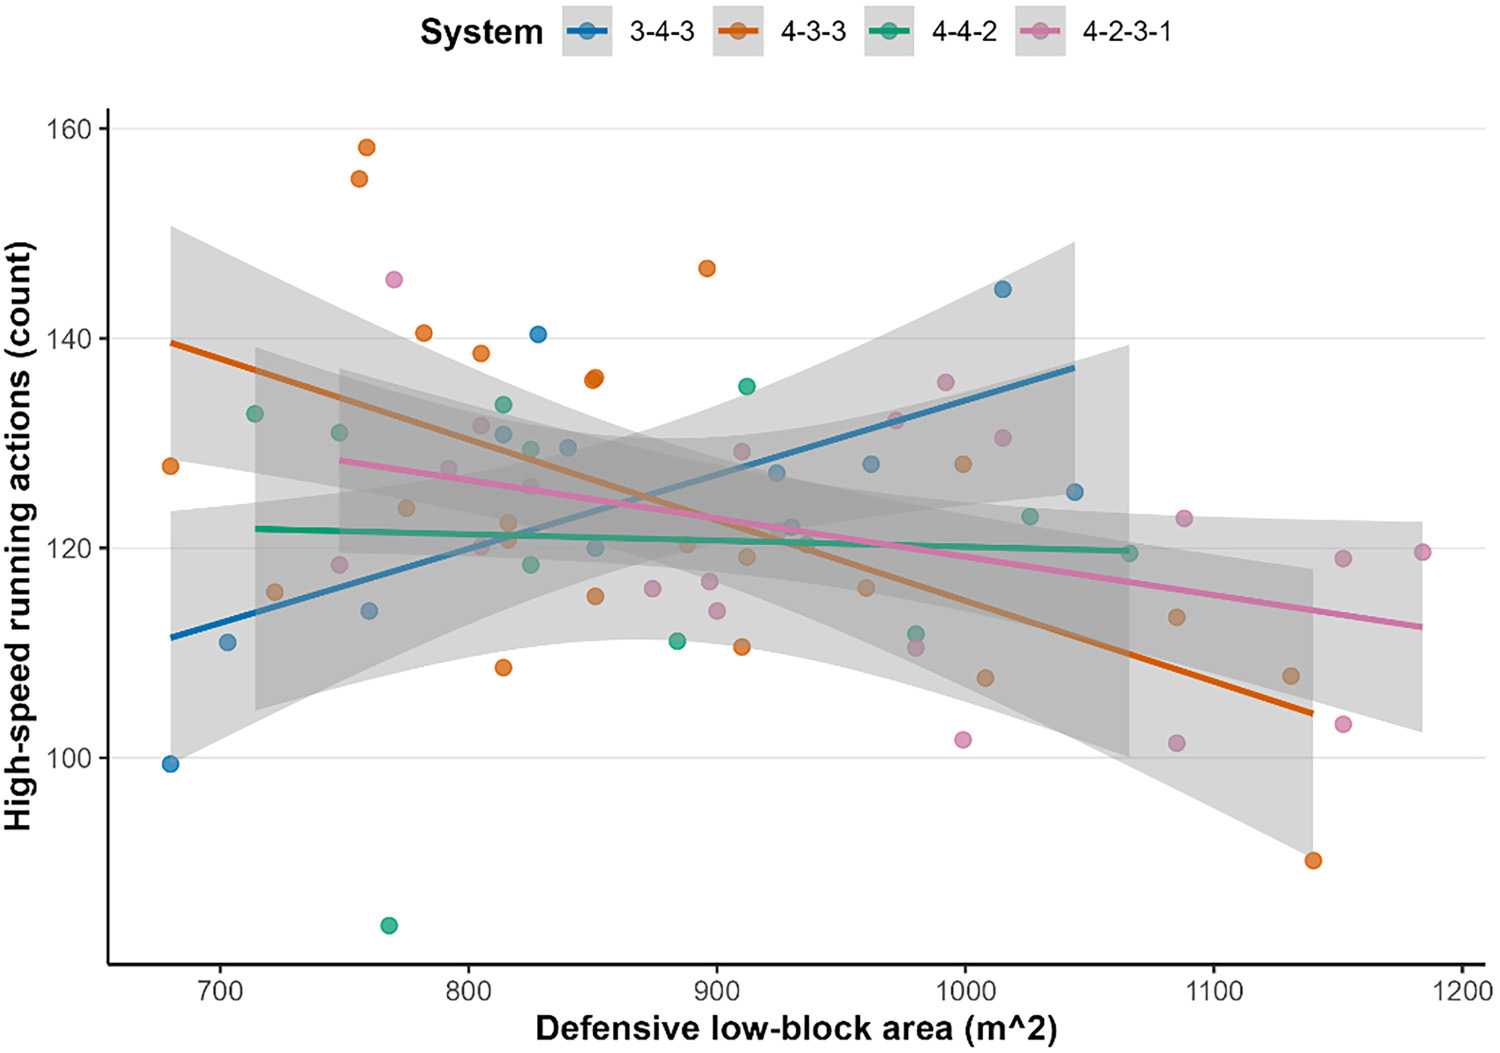
Figure 2. The low-block TSA–HSR relationship varies across tactical systems (original paper Figure 4).
Low-block TSA also interacted with formation for Zone 4 distance (adjusted p = 0.037). The 3-4-3 had a more positive slope than the 4-2-3-1.
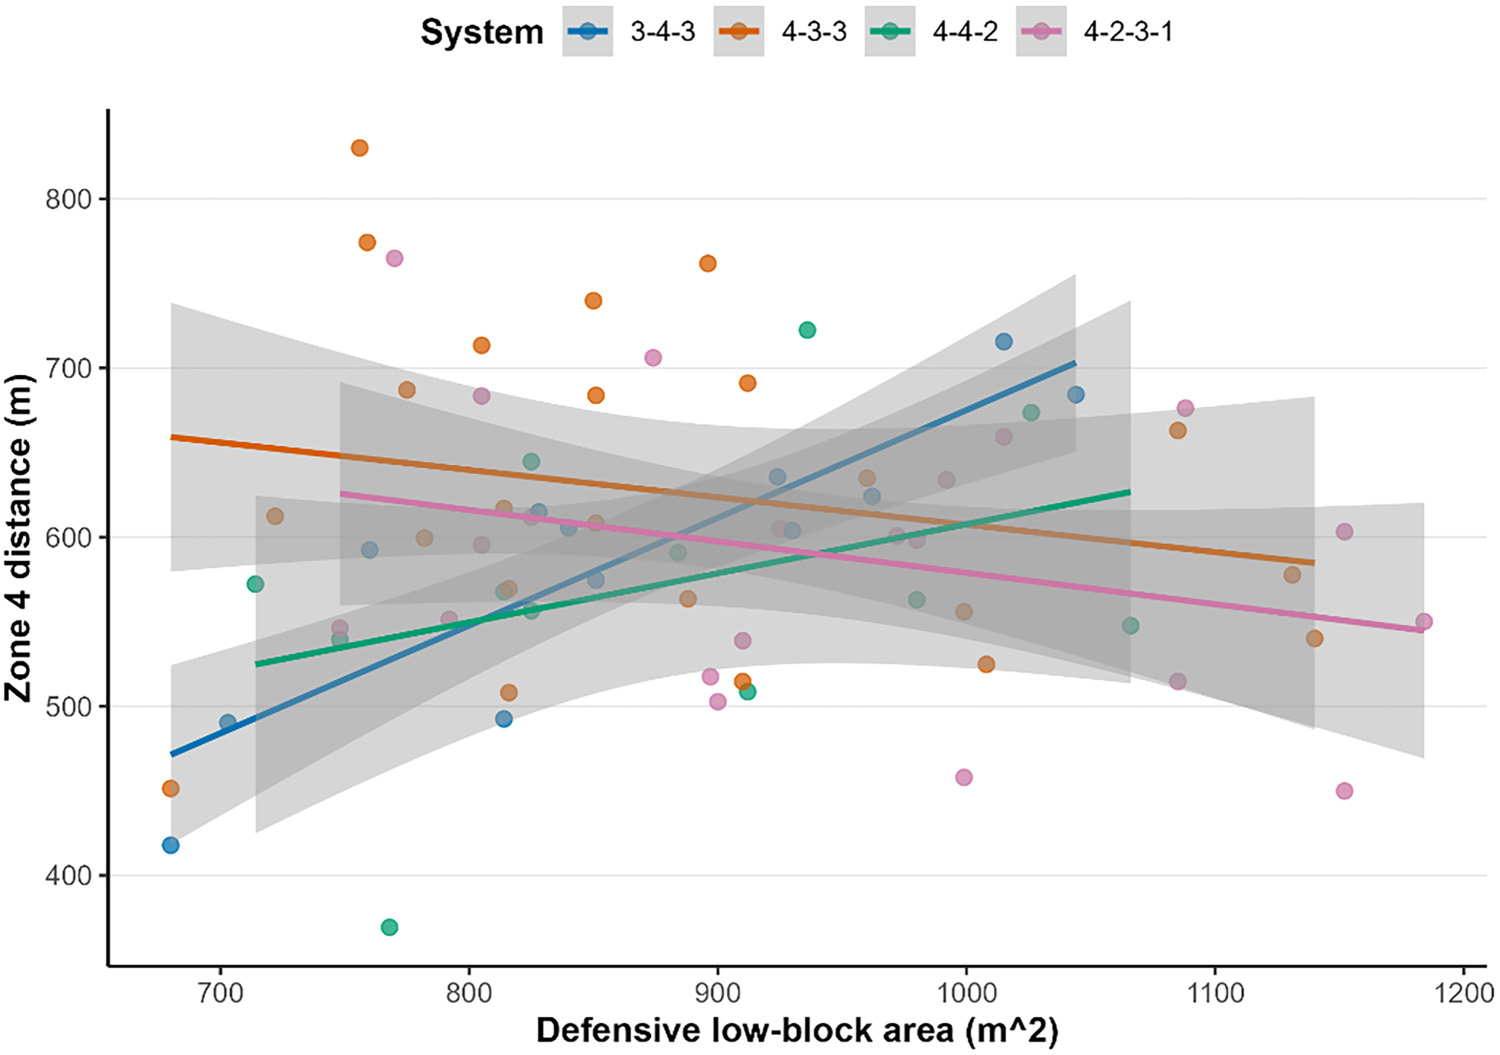
Figure 3. Low-block area and distance covered at 20–25 km/h (original paper Figure 2).
Finding 3: Mid-block spacing mattered for high-speed distance
During mid-block defending, the association between TSA and Zone 4 distance also differed by formation (adjusted p = 0.037). The 3-4-3 showed a more positive association than the 4-3-3 and 4-2-3-1.
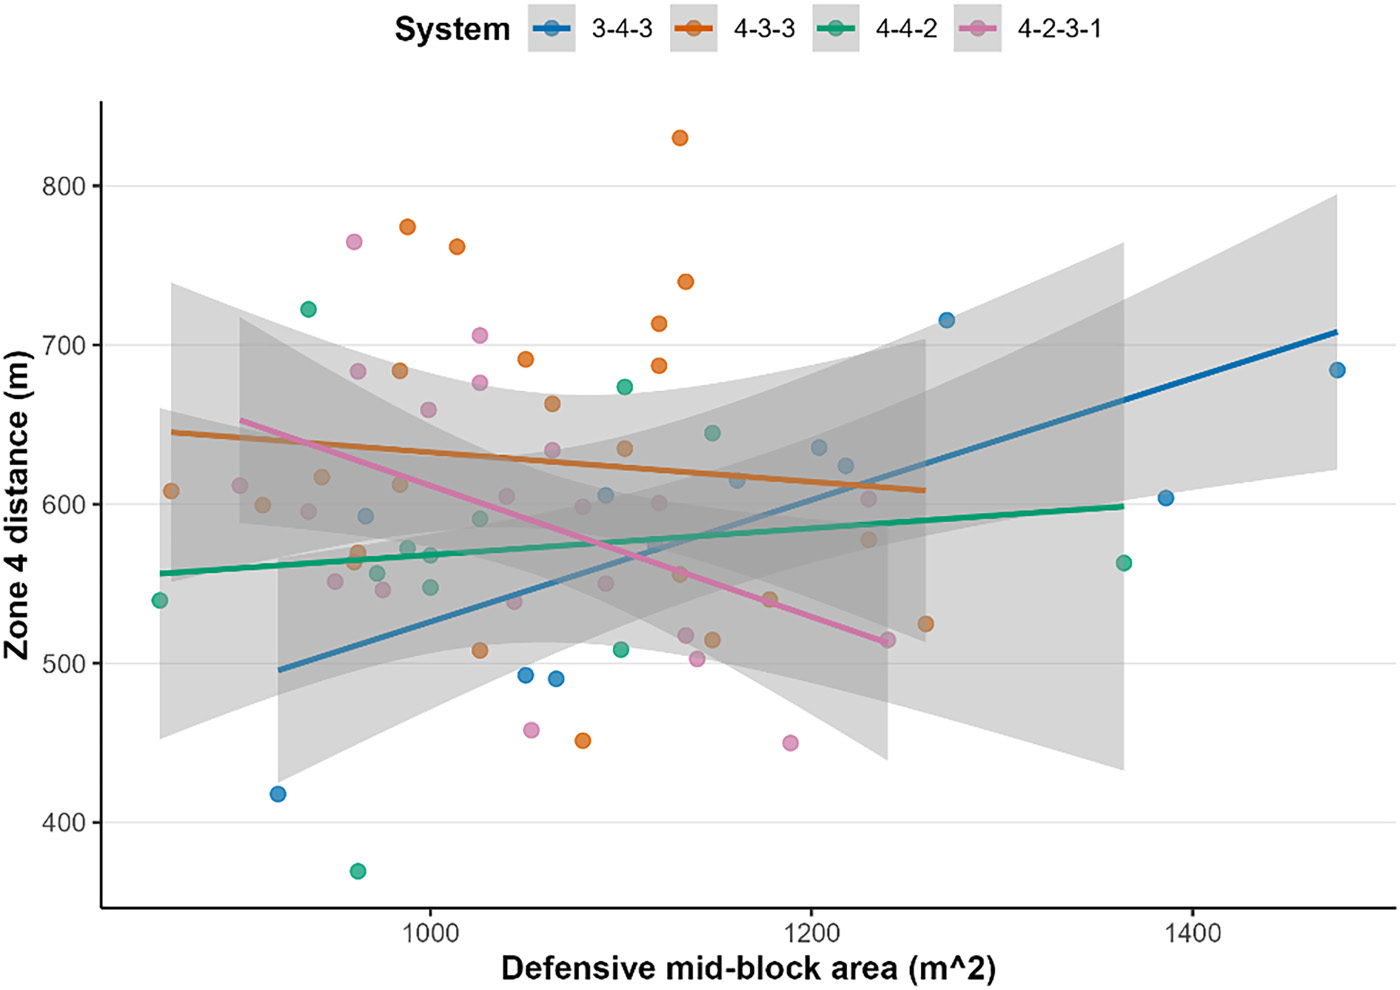
Figure 4. Mid-block TSA and Zone 4 distance (original paper Figure 3).
Finding 4: Expanding during build-up was associated with more high-speed runs
Across formations, a one-standard-deviation increase in possession build-up area was associated with approximately 6.37 additional high-speed running actions (adjusted p = 0.002). Possession build-up should not automatically be treated as a low-intensity phase.
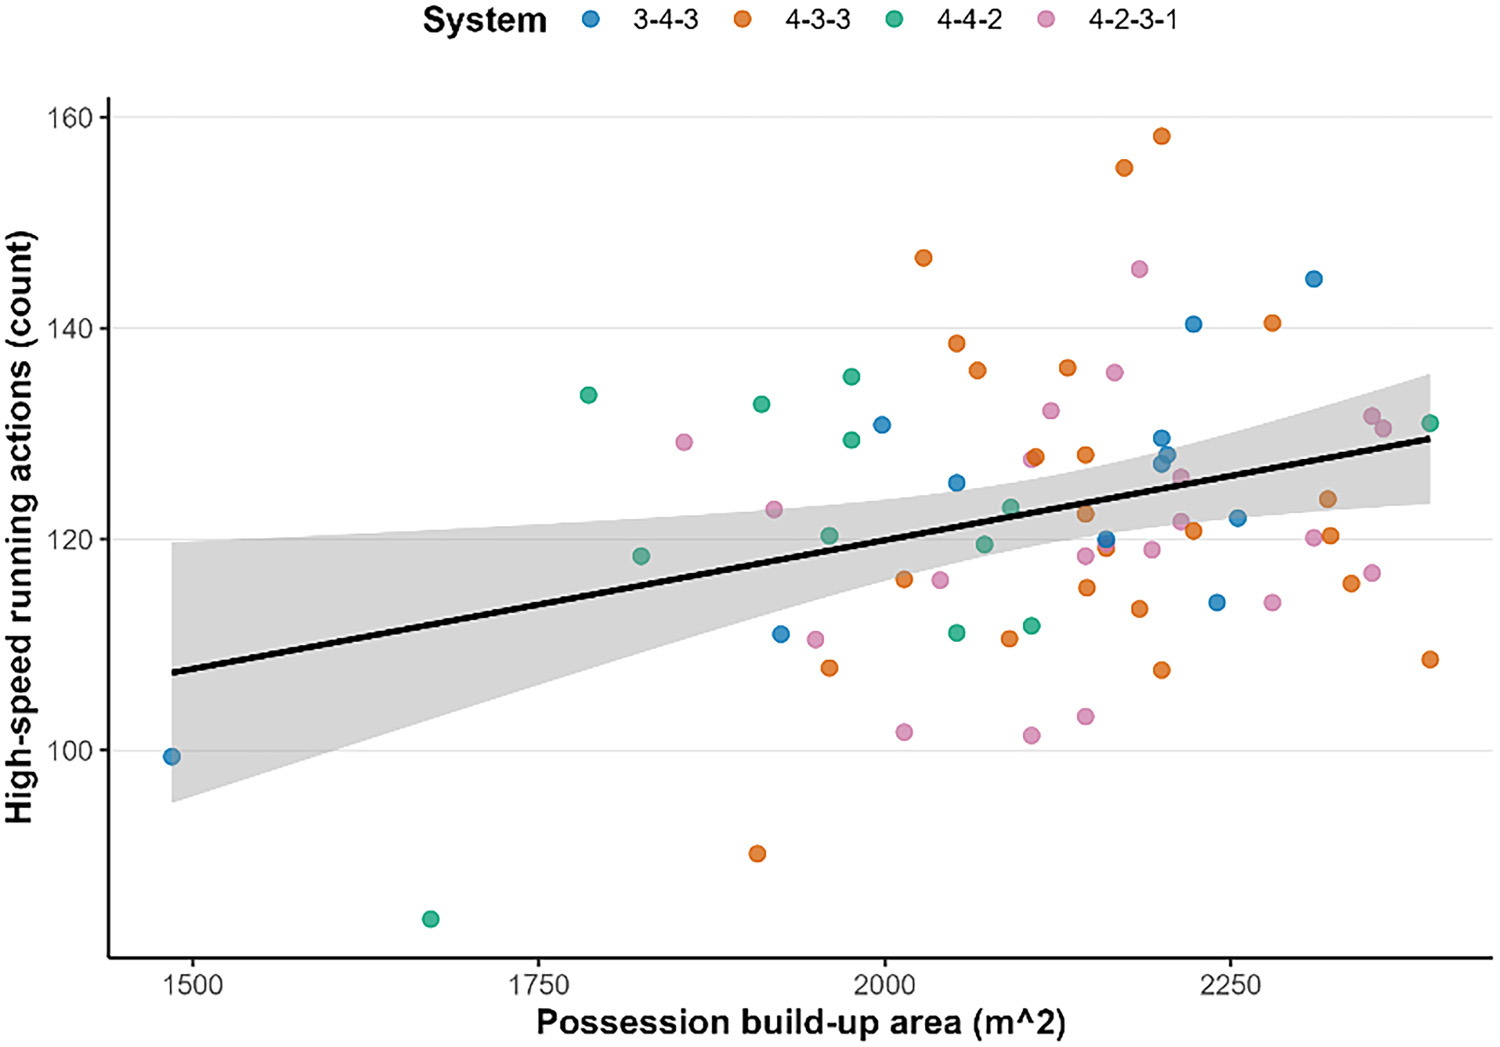
Figure 5. Build-up area and high-speed running actions (original paper Figure 5).
What didn’t show significant associations?
After multiple-testing correction, the models did not reveal significant effects for total distance, Zone 5 distance, sprint actions, or top speed. High-block area also did not yield significant effects. That distinction matters: high-speed running at 20–25 km/h is not interchangeable with sprinting above 25 km/h.
What can coaches do with these findings?
Coaches and performance analysts can use these findings to ask better questions when interpreting tracking data. Was the team defending deep or building possession? How expanded was its structure? What formation was it using? Similar distances may reflect different tactical responsibilities.
Training tasks can deliberately vary pitch dimensions and spacing to explore these relationships, but our observational results do not establish that expanding TSA causes more running. Player position, opponent behavior, match context, and transitions also matter.
The bigger picture
Soccer running performance emerges within a dynamic tactical environment. It’s not just how much players run—it’s where, when, and within what collective organization they run. Our findings support interpreting spatial and physical metrics together, while recognizing the limits of a single-tournament, team-level analysis.
Original research: Böge, V., Peker, A. T., Kılcı, A., Arruda, D., Gonçalves, B., & Lago-Peñas, C. (2026). The association of team surface area and tactical formation on match running performance in elite soccer. International Journal of Sports Science & Coaching. https://doi.org/10.1177/17479541261475500
More evidence-based coaching and sports science at Training Lab.